BMI Calculator
Body Mass Index
016.018.525.035.040.0
BMI Calculator
Body Mass Index
What is BMI ?
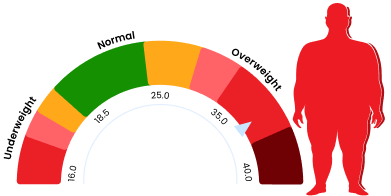
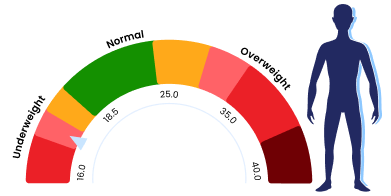
BMI serves as a measure of anindividual's body composition, taking into account their height and weight toquantify tissue mass. Its primary purpose is to assess whether a personmaintains a healthy body weight relative to their height. The calculated BMI valueis instrumental in categorising individuals into different weightclassifications, including underweight, normal weight, overweight, or obese,based on predetermined ranges. These classifications may further includedistinctions such as severely underweight or very severely obese, and they canvary depending on factors like region and age. Recognising that both beingunderweight and overweight can have notable health implications, BMI acts as avaluable indicator, prompting the need for further evaluation or intervention. Thetable represents the body weight guideline endorsed by the World HealthOrganization (WHO), derived from BMI values applicable to adults aged 20 andabove. This recommendation applies universally to both men and women.
BMI Calculator
A Body Mass Index (BMI) Calculator isa reliable tool to calculate body fat in both adults and kids. Flebo.in's BMICalculator can be used to calculate BMI by taking into consideration metricssuch as height, weight, age, and gender.Body Mass Index is a simple calculationusing a person's height and weight. The formula is BMI = kg/m2 where kg is aperson's weight in kilograms and m2 is their height in metres squared. A BMI of25.0 or more is overweight, while the healthy range is 18.5 to 24.9. BMIapplies to most adults between the ages 18-65.


Risks of Being Overweight
Being overweight leads to severe health issues as outlined below:
High Blood Pressure &Strokes
Increased LDL & Reduced HDL Cholesterol Levels
Onset of Type II Diabetes
Predisposition to Gallbladder Disease
Susceptibility to Certain Cancers(Endometrial, Breast, Colon, Kidney, Liver)
Osteoarthritis
Depression & Anxiety
Sleep Apnea & Respiratory Problems

Risks of Being underweight
Being underweight has its own set of risks as outlined below:
Malnutrition
Vitamin Deficiencies
Anemia (reduced ability to transport oxygen in the blood)
Osteoporosis (leads to bone fragility and weakness)
Reduced Immunity Levels
Hormonal Imbalances Causing Potential Reproductive Issues
Increased Risk Of Miscarriage
Growth & Development Issues in Children & Teenagers

Being overweight leads to severe health issues as outlined below:
High Blood Pressure &Strokes
Increased LDL & Reduced HDL Cholesterol Levels
Onset of Type II Diabetes
Predisposition to Gallbladder Disease
Susceptibility to Certain Cancers(Endometrial, Breast, Colon, Kidney, Liver)
Osteoarthritis
Depression & Anxiety
Sleep Apnea & Respiratory Problems
In certain instances, being underweight may indicate an underlying condition or disease. If you suspect that you or someone you know is underweight, especially if the reason for being underweight is not apparent, it is advisable to consult a doctor for guidance.
What is the recommended weight For My Height?
The following weight and height chart is a general guideline for categories of normal weight, overweight, obesity, and severe obesity.
| Height | Moderate Weight BMI 19-24 | Overweight BMI 25-29 | Obesity BMI 30-39 | Severe Obesity BMI 40+ |
|---|---|---|---|---|
| 4 ft 10 in (58 in) | 91-115 lb | 119-138 lb | 143-186 lb | 191-258 lb |
| 4 ft 11 in (59 in) | 94-119 lb | 124-143 lb | 148-193 lb | 198-267 lb |
| 5 ft 0 in (60 in) | 97-123 lb | 128-148 lb | 153-199 lb | 204-276 lb |
| 5 ft 1 in (61 in) | 100-127 lb | 132-153 lb | 158-206 lb | 211-285 lb |
| 5 ft 2 in (62 in) | 104-131 lb | 136-158 lb | 164-213 lb | 218-295 lb |
| 5 ft 3 in (63 in) | 107-135 lb | 141-163 lb | 169-220 lb | 225-304 lb |
| 5 ft 4 in (64 in) | 110-140 lb | 145-169 lb | 174-227 lb | 232-314 lb |
| 5 ft 5 in (65 in) | 114-144 lb | 150-174 lb | 180-234 lb | 240-324 lb |
| 5 ft 6 in (66 in) | 118-148 lb | 155-179 lb | 186-241 lb | 247-334 lb |
| 5 ft 7 in (67 in) | 121-153 lb | 159-185 lb | 191-249 lb | 255-344 lb |
| 5 ft 8 in (68 in) | 125-158 lb | 164-190 lb | 197-256 lb | 262-354 lb |
| 5 ft 9 in (69 in) | 128-162 lb | 169-196 lb | 203-263 lb | 270-365 lb |
| 5 ft 10 in (70 in) | 132-167 lb | 174-202 lb | 209-271 lb | 278-376 lb |
| 5 ft 11 in (71 in) | 136-172 lb | 179-208 lb | 215-279 lb | 286-387 lb |
| 6 ft 0 in (72 in) | 140-177 lb | 184-213 lb | 221-287 lb | 294-397 lb |
| 6 ft 1 in (73 in) | 144-182 lb | 189-219 lb | 227-295 lb | 302-408 lb |
| 6 ft 2 in (74 in) | 148-186 lb | 194-225 lb | 233-303 lb | 311-420 lb |
| 6 ft 3 in (75 in) | 152-192 lb | 200-232 lb | 240-311 lb | 319-431 lb |
| 6 ft 4 in (76 in) | 156-197 lb | 205-238 lb | 246-320 lb | 328-443 lb |
BMI Table For Children And Teens From Age 2-20
| BMI Percentile | Health Status |
|---|---|
| Less than 5th percentile | Underweight |
| 5th percentile to 85th percentile | Healthy Weight |
| 85th percentile to 95th percentile | Overweight |
| Equal or more than 95th percentile | Obese |
Time To Take Action
If your BMI calculator results diagnose your health status as overweight or obese you must take action!
Adopting the following habits can help bring your BMI to healthier levels:

Regular Exercise
Start with cardio exercises that burn calories and improve blood circulation. Then progress to exercises that build muscle and target belly fat. This strengthens the body against potential heart-related and cholesterol problems.

Healthy Food
It's essential to make the right dietary choices and reduce the consumption of oily and high-calorie foods. Instead, a diet rich in proteins, fruits, lean meats, vegetables, and whole grains should be adopted.

No Overeating
Dieting can increase your cravings to overeat during cheat days. In such situations, it's important to be conscious of your portions to facilitate proper digestion. This will prevent excess undigested nutrients from getting stored as fats.
Limitations of BMI
While BMI serves as a valuable metric for assessing healthy body weight, it is not without its constraints. BMI functions as an approximation & does not factor in variations in body composition. Considering the diverse array of body types & the distribution of muscle, bone mass, & fat, it is recommended to utilise BMI in conjunction with other metrics rather than relying solely on it to determine an individual's healthy body weight. Nevertheless, it is important to note that BMI remains a reasonably indicative measure of body fat for 90-95% of the population.

For Adults:
BMI's accuracy is limited as it considers excess body weight rather than excess body fat. Several factors, including age, gender, ethnicity, muscle mass, body fat, and activity level influence BMI. For instance, an individual classified as healthy may harbor substantial body fat. Conversely, in the realm of athletes, high muscle density contributes to a heavier weight, classifying them as overweight despite them maintaining a healthy weight based on body composition.

For Children & Adolescents:
The limitations affecting the accuracy of BMI in adults are applicable to children and adolescents as well.Furthermore, factors such as height and the stage of sexual maturation can impact BMI and body fat assessment in children. BMI proves to be a more reliable measure of excess body fat in obese children. In cases of overweight children, their BMI may reflect elevated levels of either fat or fat-free mass.For lean children, variations in BMI may be attributed to differences in fat-free mass.
ALTERNATE METHODS TO ESTIMATE WEIGHT-RELATED HEALTH RISKS
Waist Circumference: Measuring your waist helps to determine fat stored in your body more accurately than BMI. With waist circumference, you can know where most fat in your body is getting stored. If your waist circumference is above 35 inches for women and 40 inches for men, you might run a higher risk of contracting chronic illnesses. To accurately measure your waist circumference, place a tape around your mid-region, above your hip bones, and measure the circumference.
Waist-to-Hip Ratio: The waist-to-hip ratio takes fats stored around your hips, waist, and buttocks into consideration. As per research, people who carry weight around their waist-hip region tend to be overweight. They stand at high risk of health conditions like type-2 diabetes and other health issues. As per the World Health Organisation the ideal ratio for men is 0.9 or less for women is 0.85 or less.
Waist-to-Height Ratio: This ratio compares your waist circumference to your height and presents results to reflect fat distribution in your body. This is a good indicator of their vulnerability to heart attack and other health conditions related to obesity. The ideal weight-to-height ratio is 0.50 for men & women.